
Page 19 - Education and Inclusive Growth --Jong-Wha Lee Korea University
P. 19
Education and Inclusive Growthc165
Equation (7) and of income Gini and educational attainment in Equation (8).
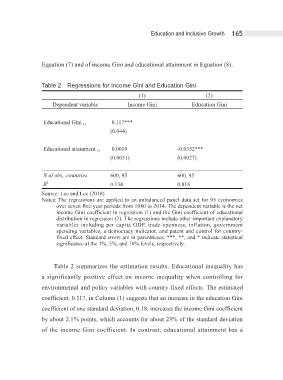
Table 2cRegressions for Income Gini and Education Gini
(1) (2)
Dependent variable Income Gini Education Gini
0.117***
Educational Gini t-1
(0.044)
0.0019 -0.0352***
Educational attainment t-1
(0.0031) (0.0027)
N of obs., countries 600, 95 600, 95
R 2 0.134 0.818
Source: Lee and Lee (2018)
Notes: The regressions are applied to an unbalanced panel data set for 95 economies
over seven five-year periods from 1980 to 2014. The dependent variable is the net
income Gini coefficient in regression (1) and the Gini coefficient of educational
distribution in regression (2). The regressions include other important explanatory
variables including per capita GDP, trade openness, inflation, government
spending variables, a democracy indicator, and patent and control for country-
fixed effect. Standard errors are in parentheses. ***, **, and * indicate statistical
significance at the 1%, 5%, and 10% levels, respectively.
Table 2 summarizes the estimation results. Educational inequality has
a significantly positive effect on income inequality when controlling for
environmental and policy variables with country fixed effects. The estimated
coefficient, 0.117, in Column (1) suggests that an increase in the education Gini
coefficient of one standard deviation, 0.18. increases the income Gini coefficient
by about 2.1% points, which accounts for about 23% of the standard deviation
of the income Gini coefficient. In contrast, educational attainment has a